Dashboard
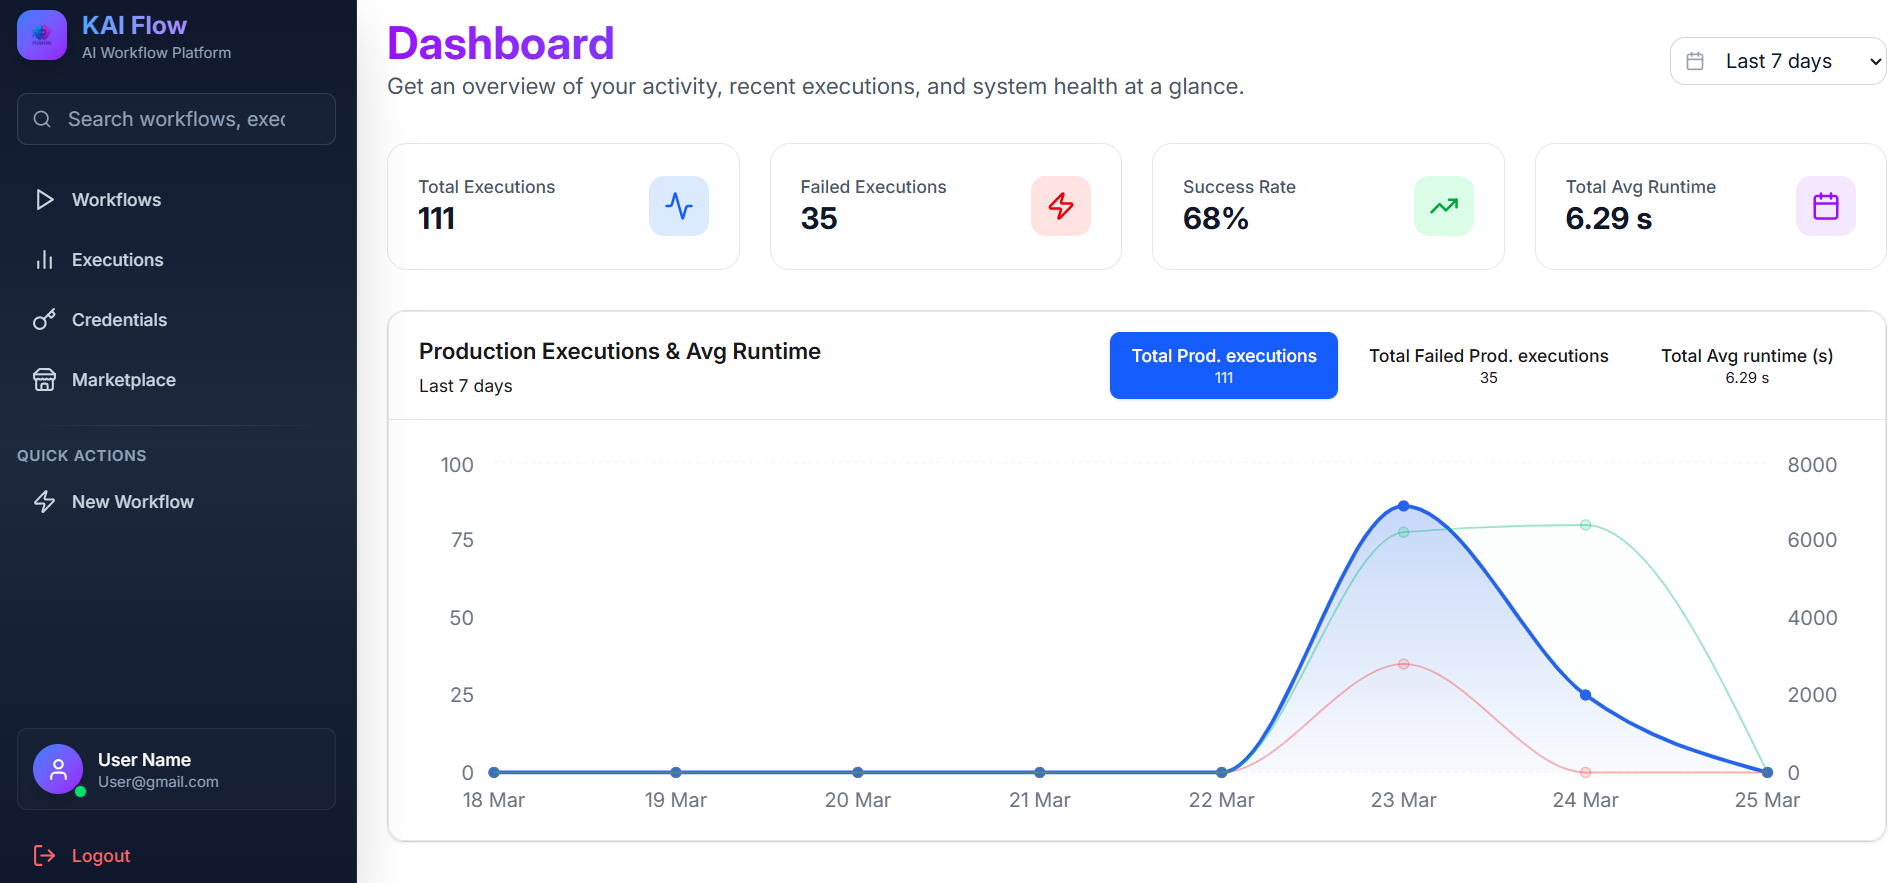
The Dashboard provides an overview of workflow execution activity and performance metrics.
Period Selector
Use the period selector to filter dashboard data by time range. Available options are Last 7 days, Last 30 days, and Last 90 days.
Statistics Cards
The dashboard displays four statistics cards:
- Total Executions: Shows the total number of workflow executions.
- Failed Executions: Shows the number of failed executions.
- Success Rate: Shows the percentage of successful executions.
- Avg Runtime: Shows the average execution time in seconds.
Analytics Chart
The Production Executions & Avg Runtime chart provides an interactive view of execution trends. It displays:
- Production executions
- Failed production executions
- Average runtime in seconds
The chart is updated based on the selected time period.